
Conversion analytics & video A/B testing
Measure the real impact of your videos on revenue, conversion rate, and customer behavior.
JOIN tracks every video interaction across the customer journey and connects engagement to business outcomes. Run A/B tests on videos to continuously improve performance.


























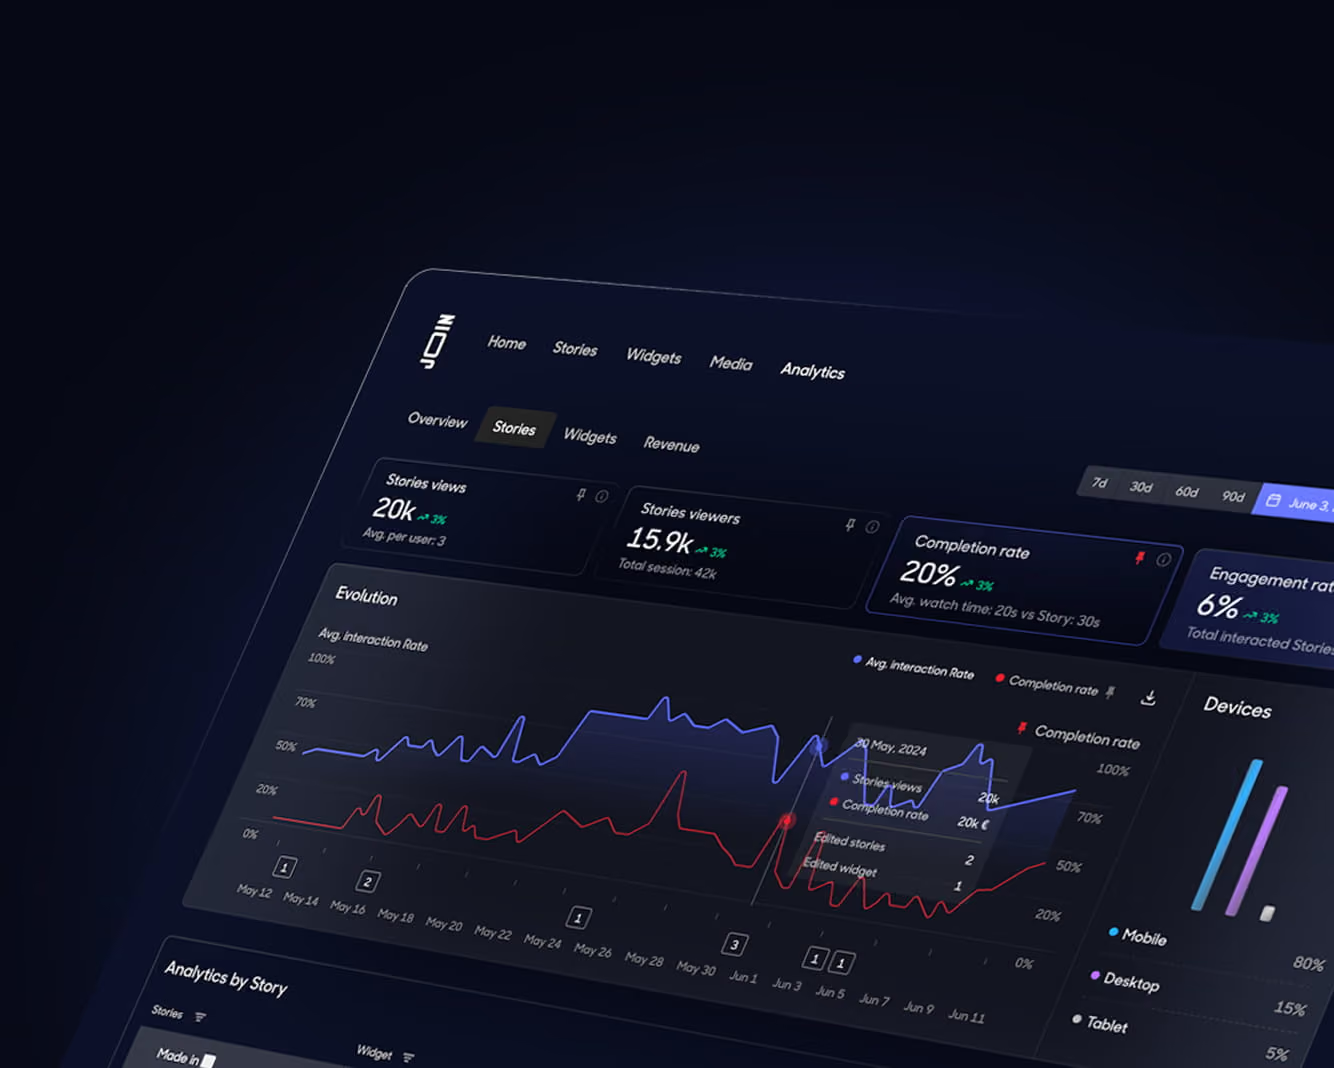
Ecommerce video analytics that goes beyond views
Most video platforms stop at impressions and engagement. JOIN shows how every video contributes to conversion, revenue, and customer behavior.
Understand exactly which videos generate sales and revenue.
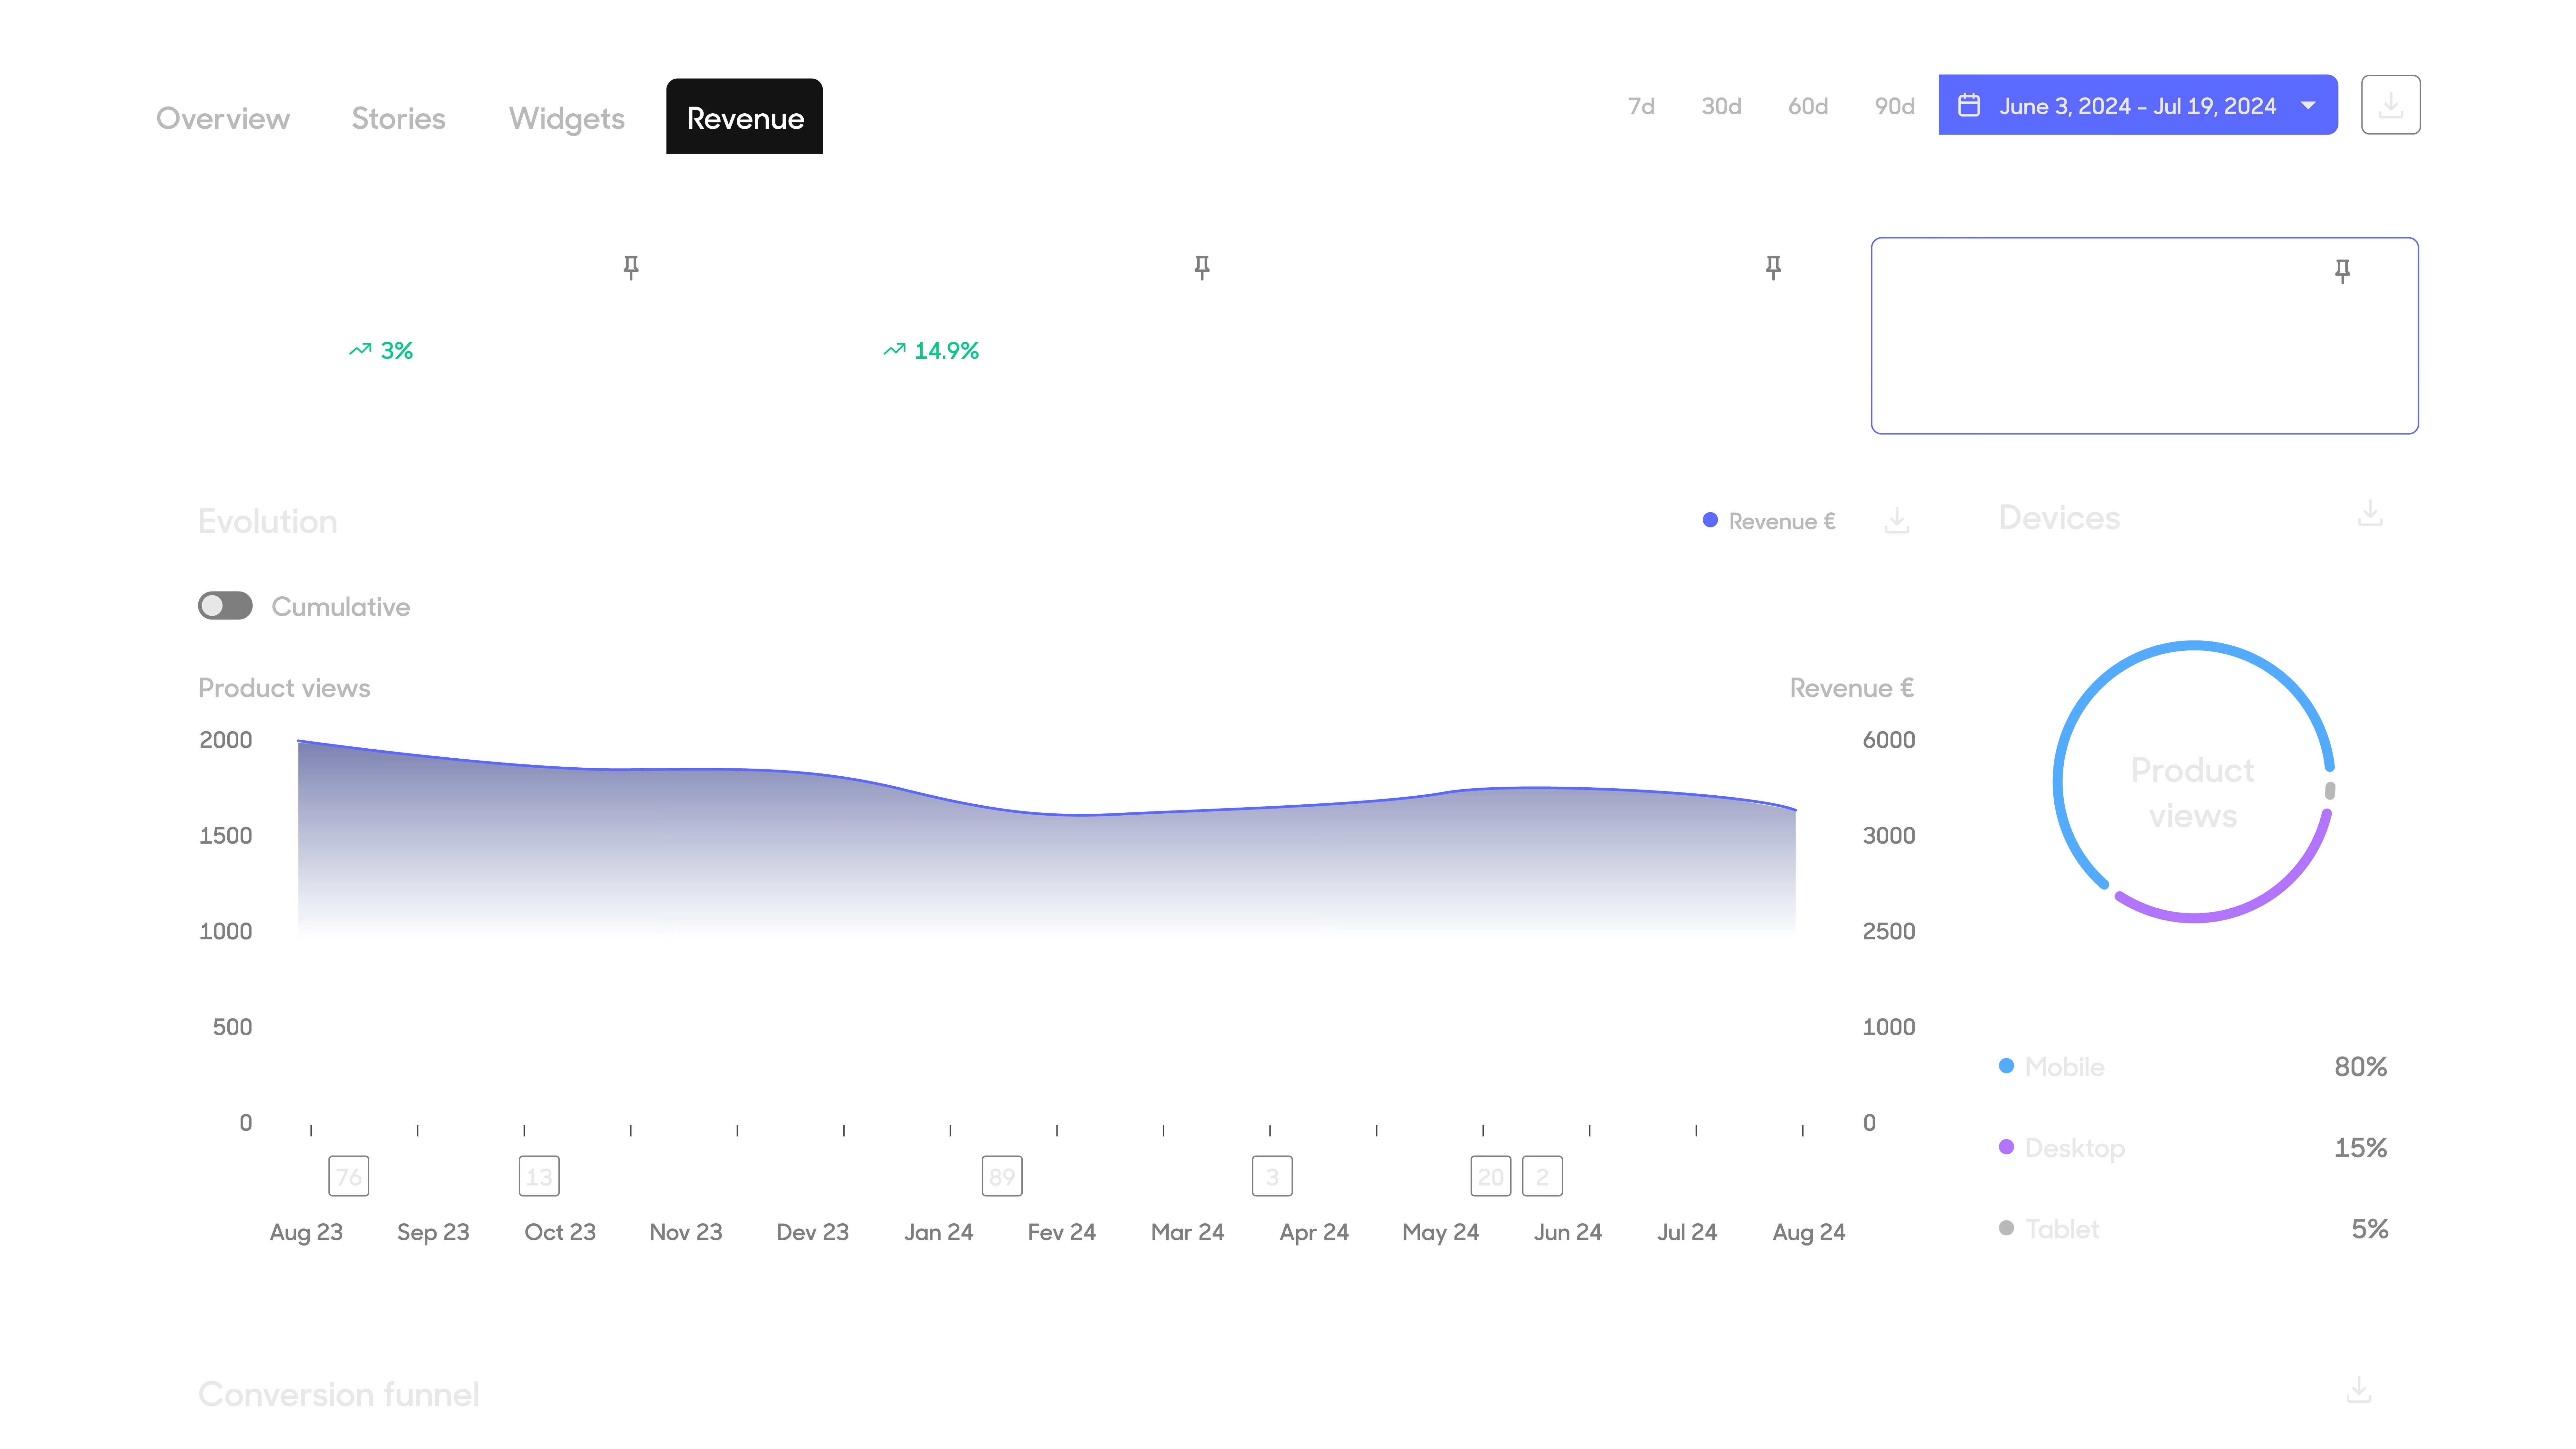
Track the KPIs that matter most to your business: conversion rate, add-to-cart rate, revenue per visitor, AOV, and more.

Identify your highest-converting videos, products, and pages.
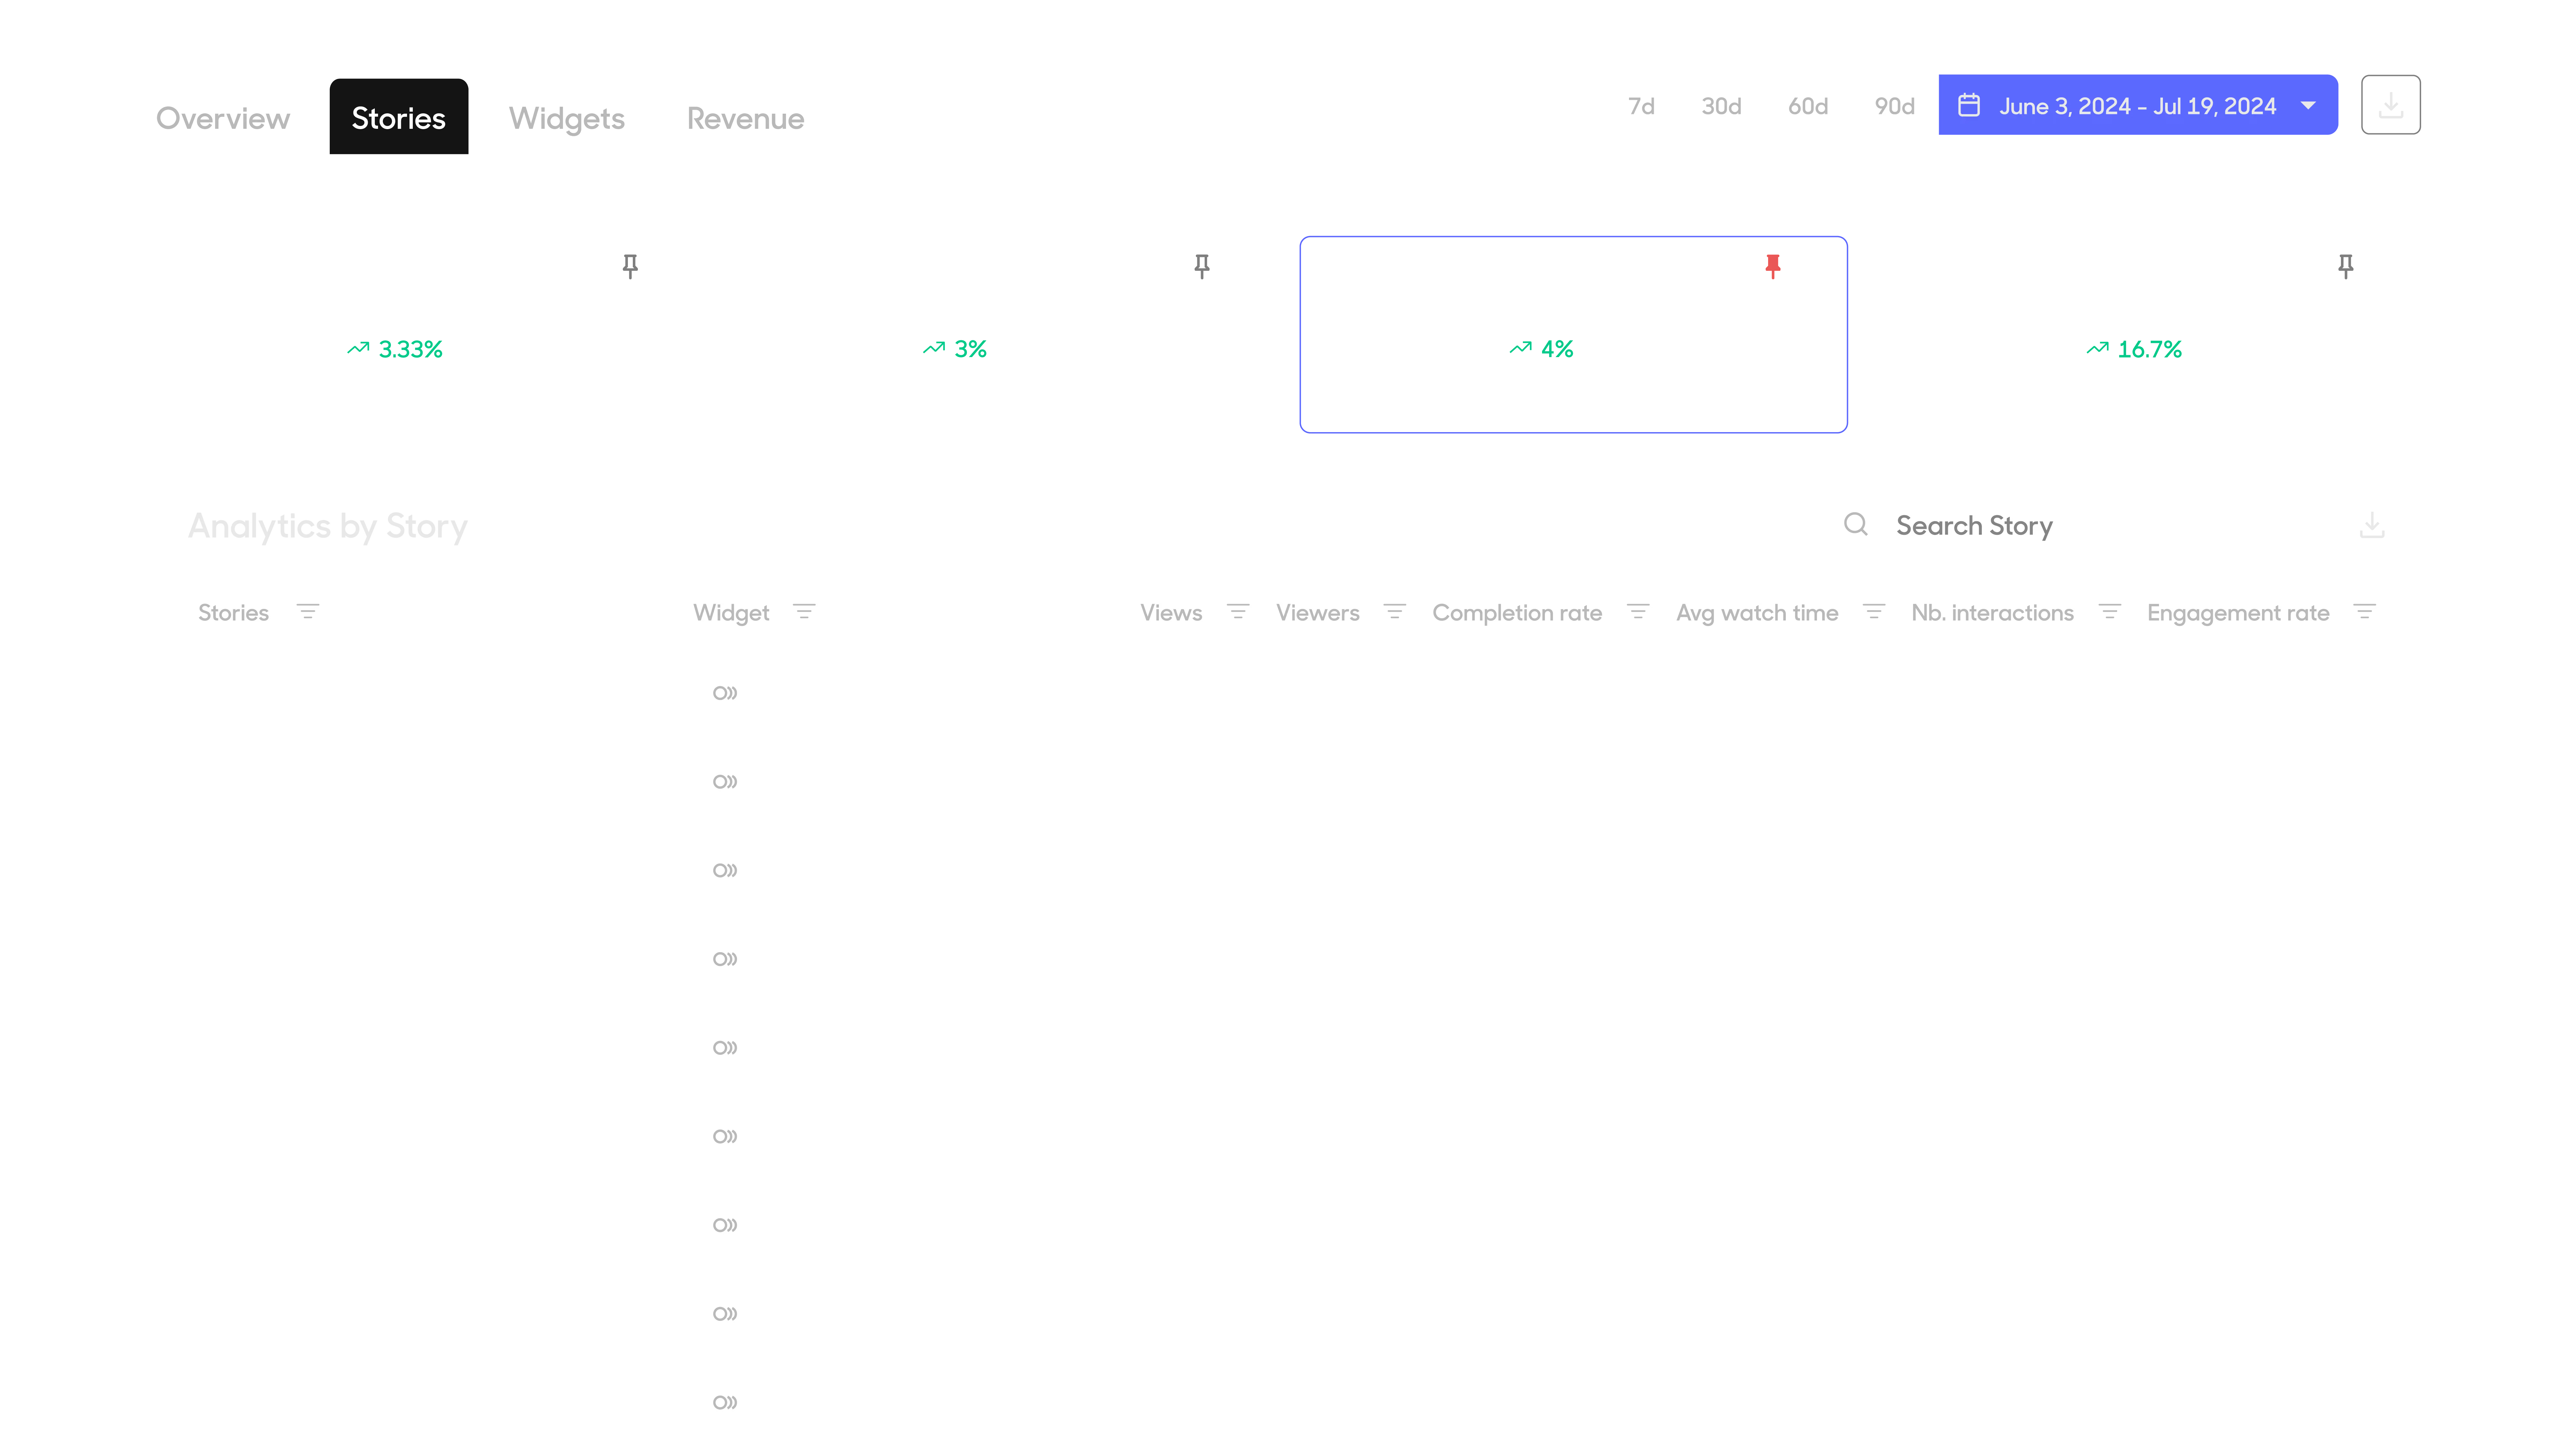
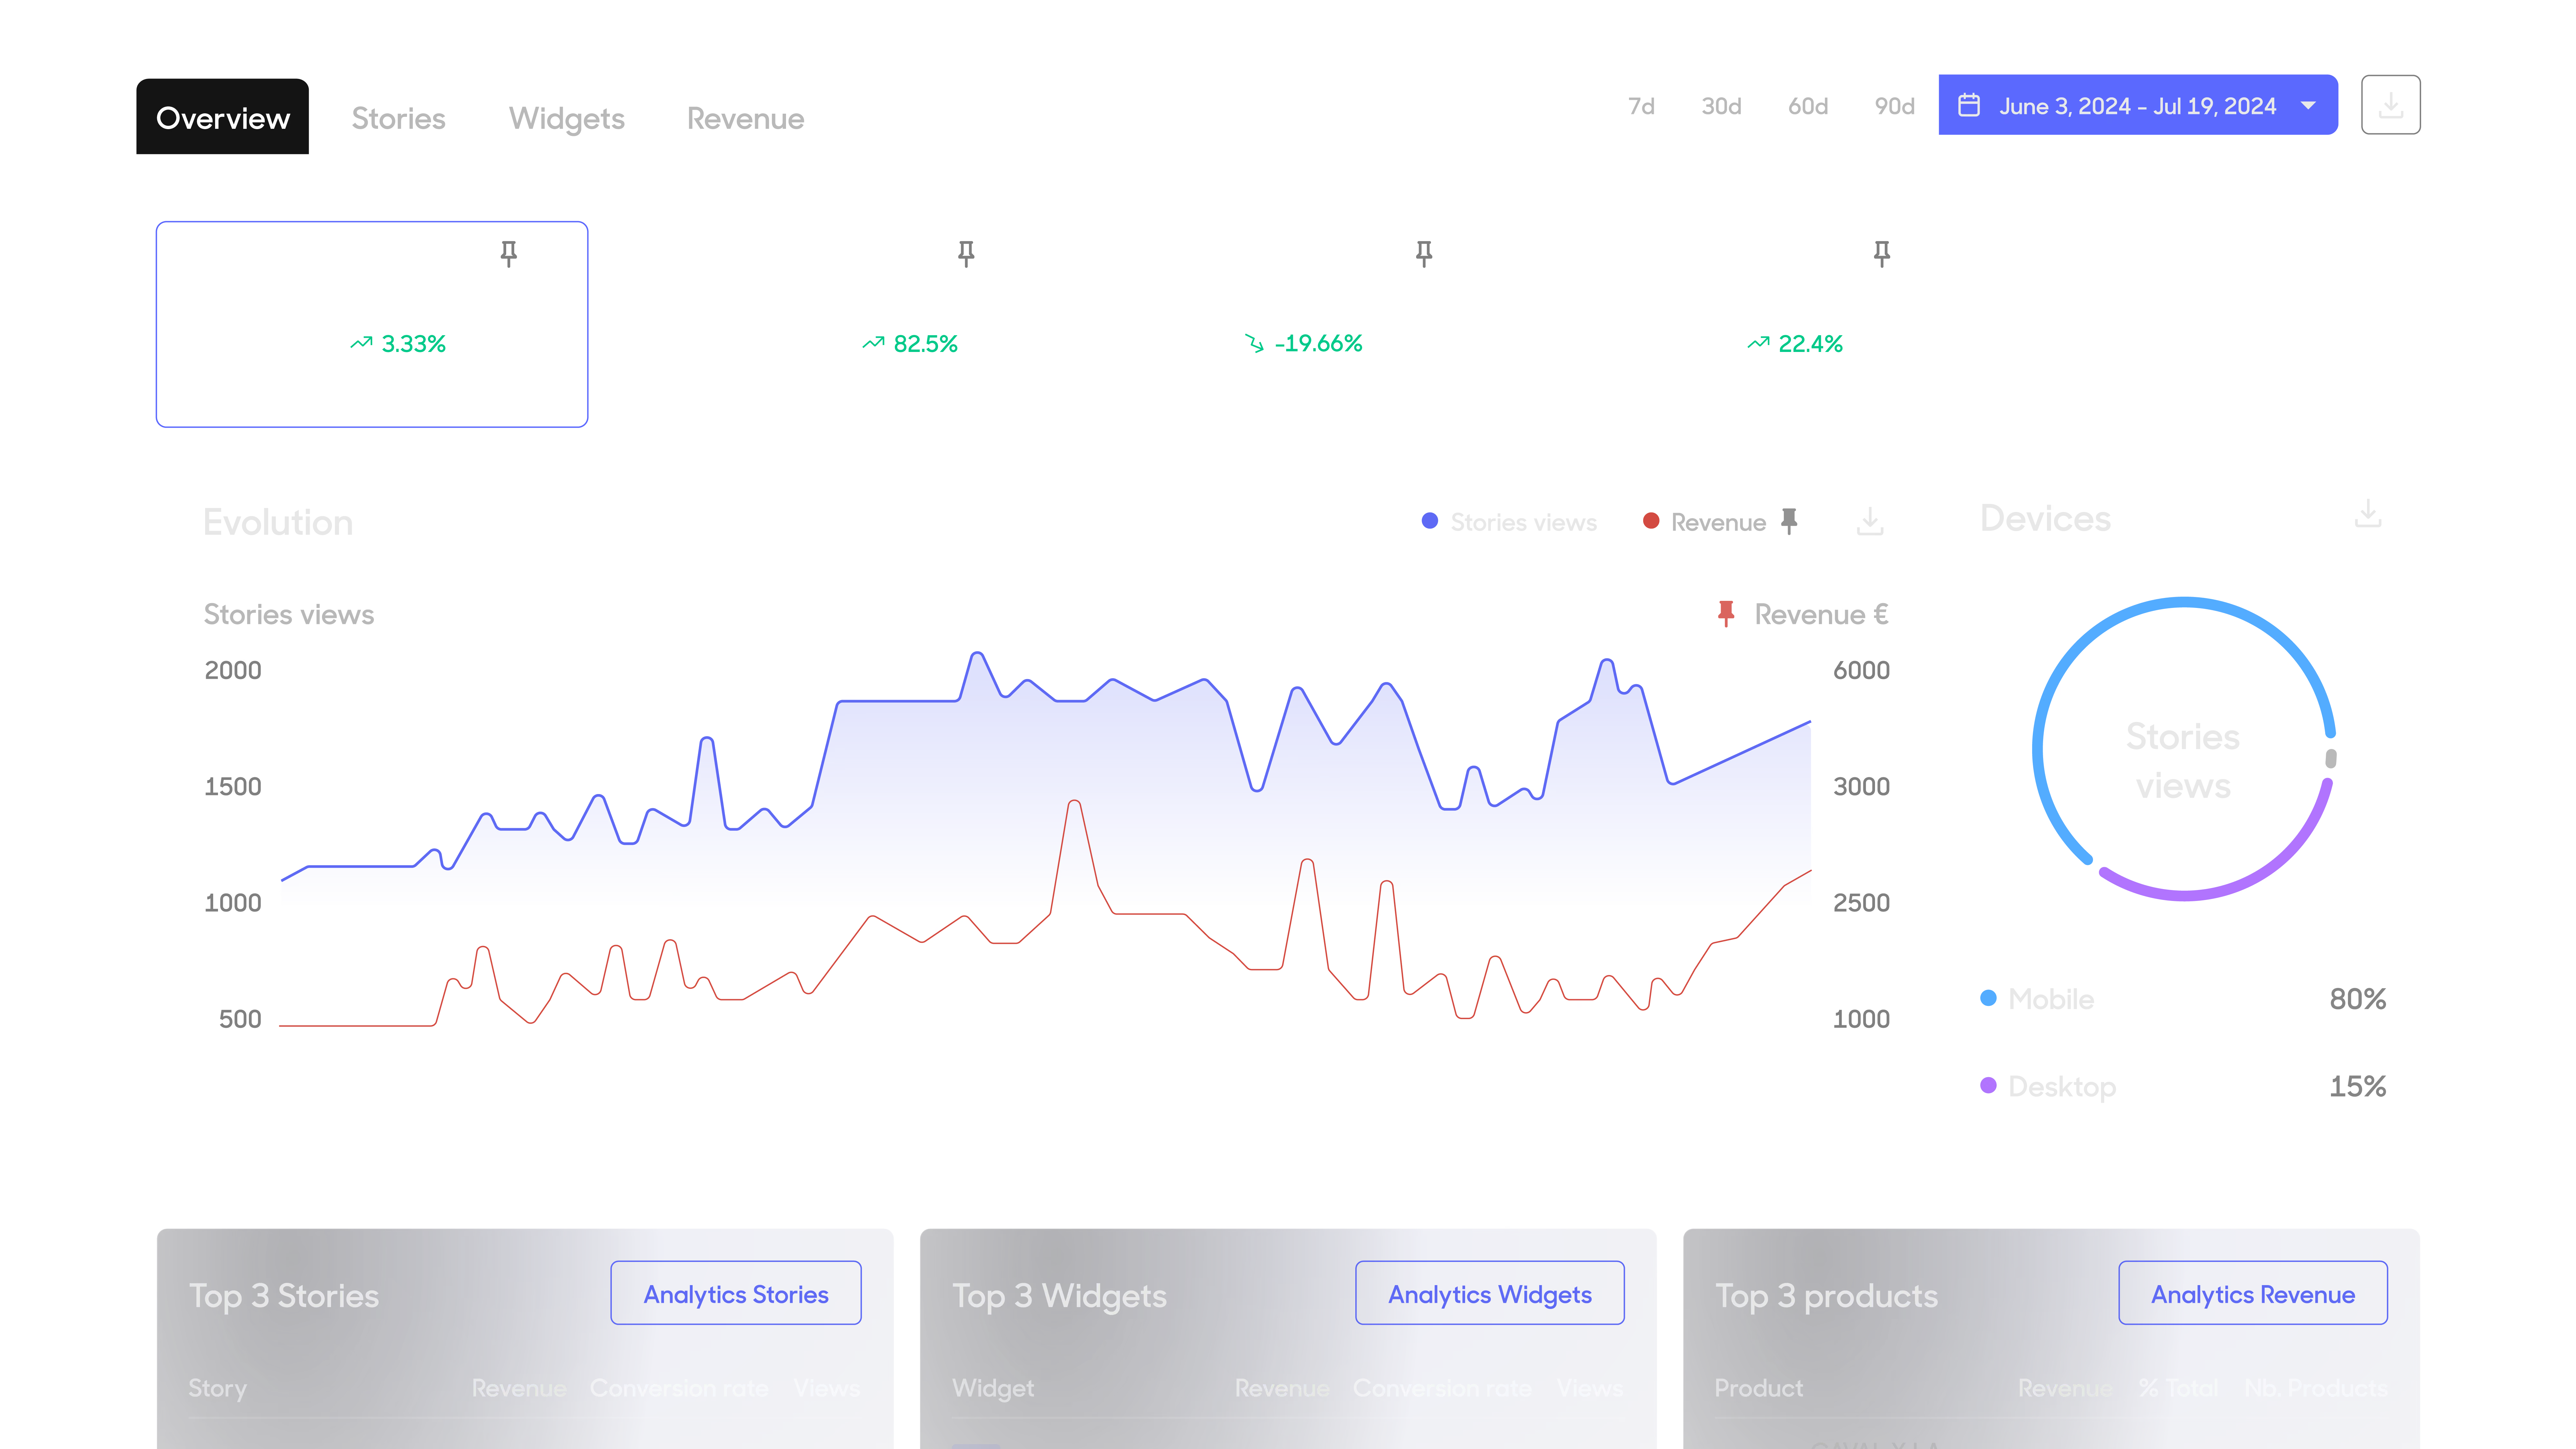
Monitor performance across website, mobile app, and campaigns from one place.
Proven revenue impact
+26%
Average increase in add-to-cart rate
+19%
Average conversion lift
+12%
Average increase in AOV
x14
ROI achieved
Understand where video influences conversion
See the complete journey from discovery to purchase. JOIN connects video engagement with ecommerce outcomes so you know where content creates value.

Which videos keep visitors interested?

Which content drives add-to-cart clicks?

Which videos generate actual revenue?


x6
Conversion rate
“Shoppable videos create an interactive and engaging experience that encourages visitors to spend more time on the website. That’s what we value most about this format.”

Leslie Cuynat
Head of D2C Marketing France - Asus


Run A/B tests on your video strategy
Get statistically significant answers to your questions. Does video actually increase conversion? Which video performs best? Where should videos be displayed? Which format generates engagement?
Test video vs. no video
Measure the incremental impact of video on conversion.
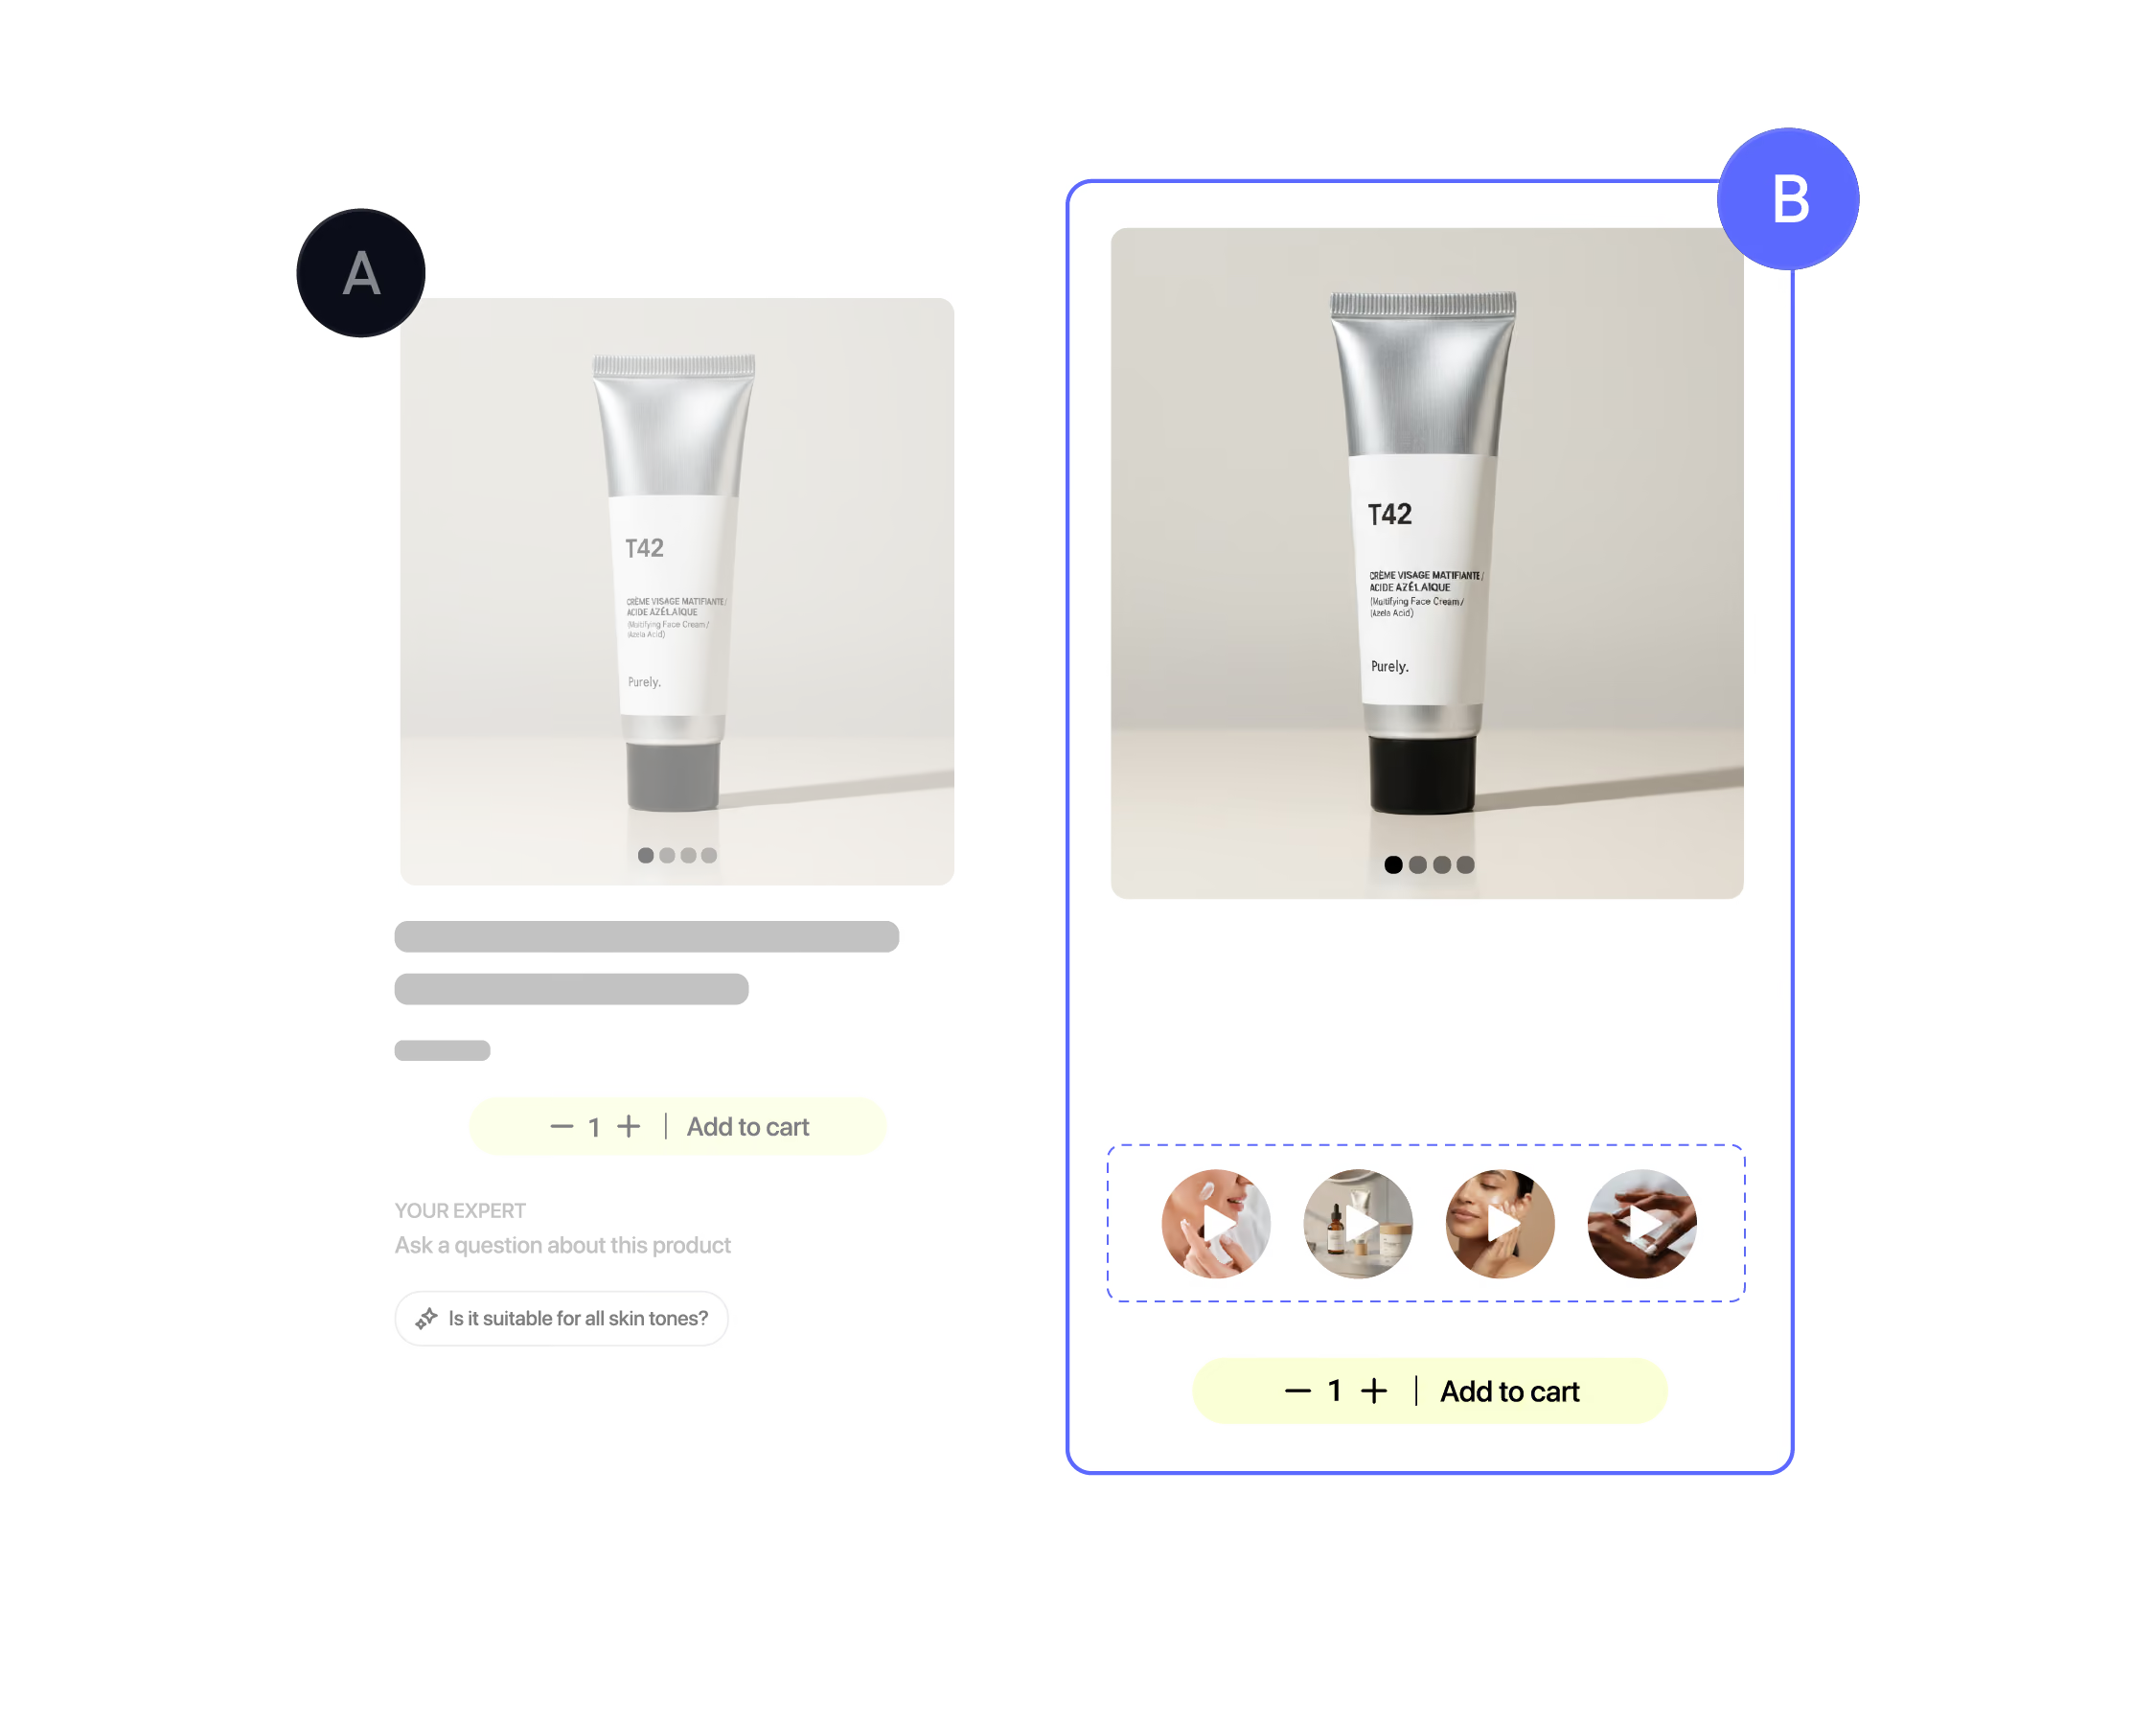
Test multiple videos
Identify the highest-performing creative for each product.

Test video placements
Measure performance across your homepage, PDPs, PLPs, and carts.
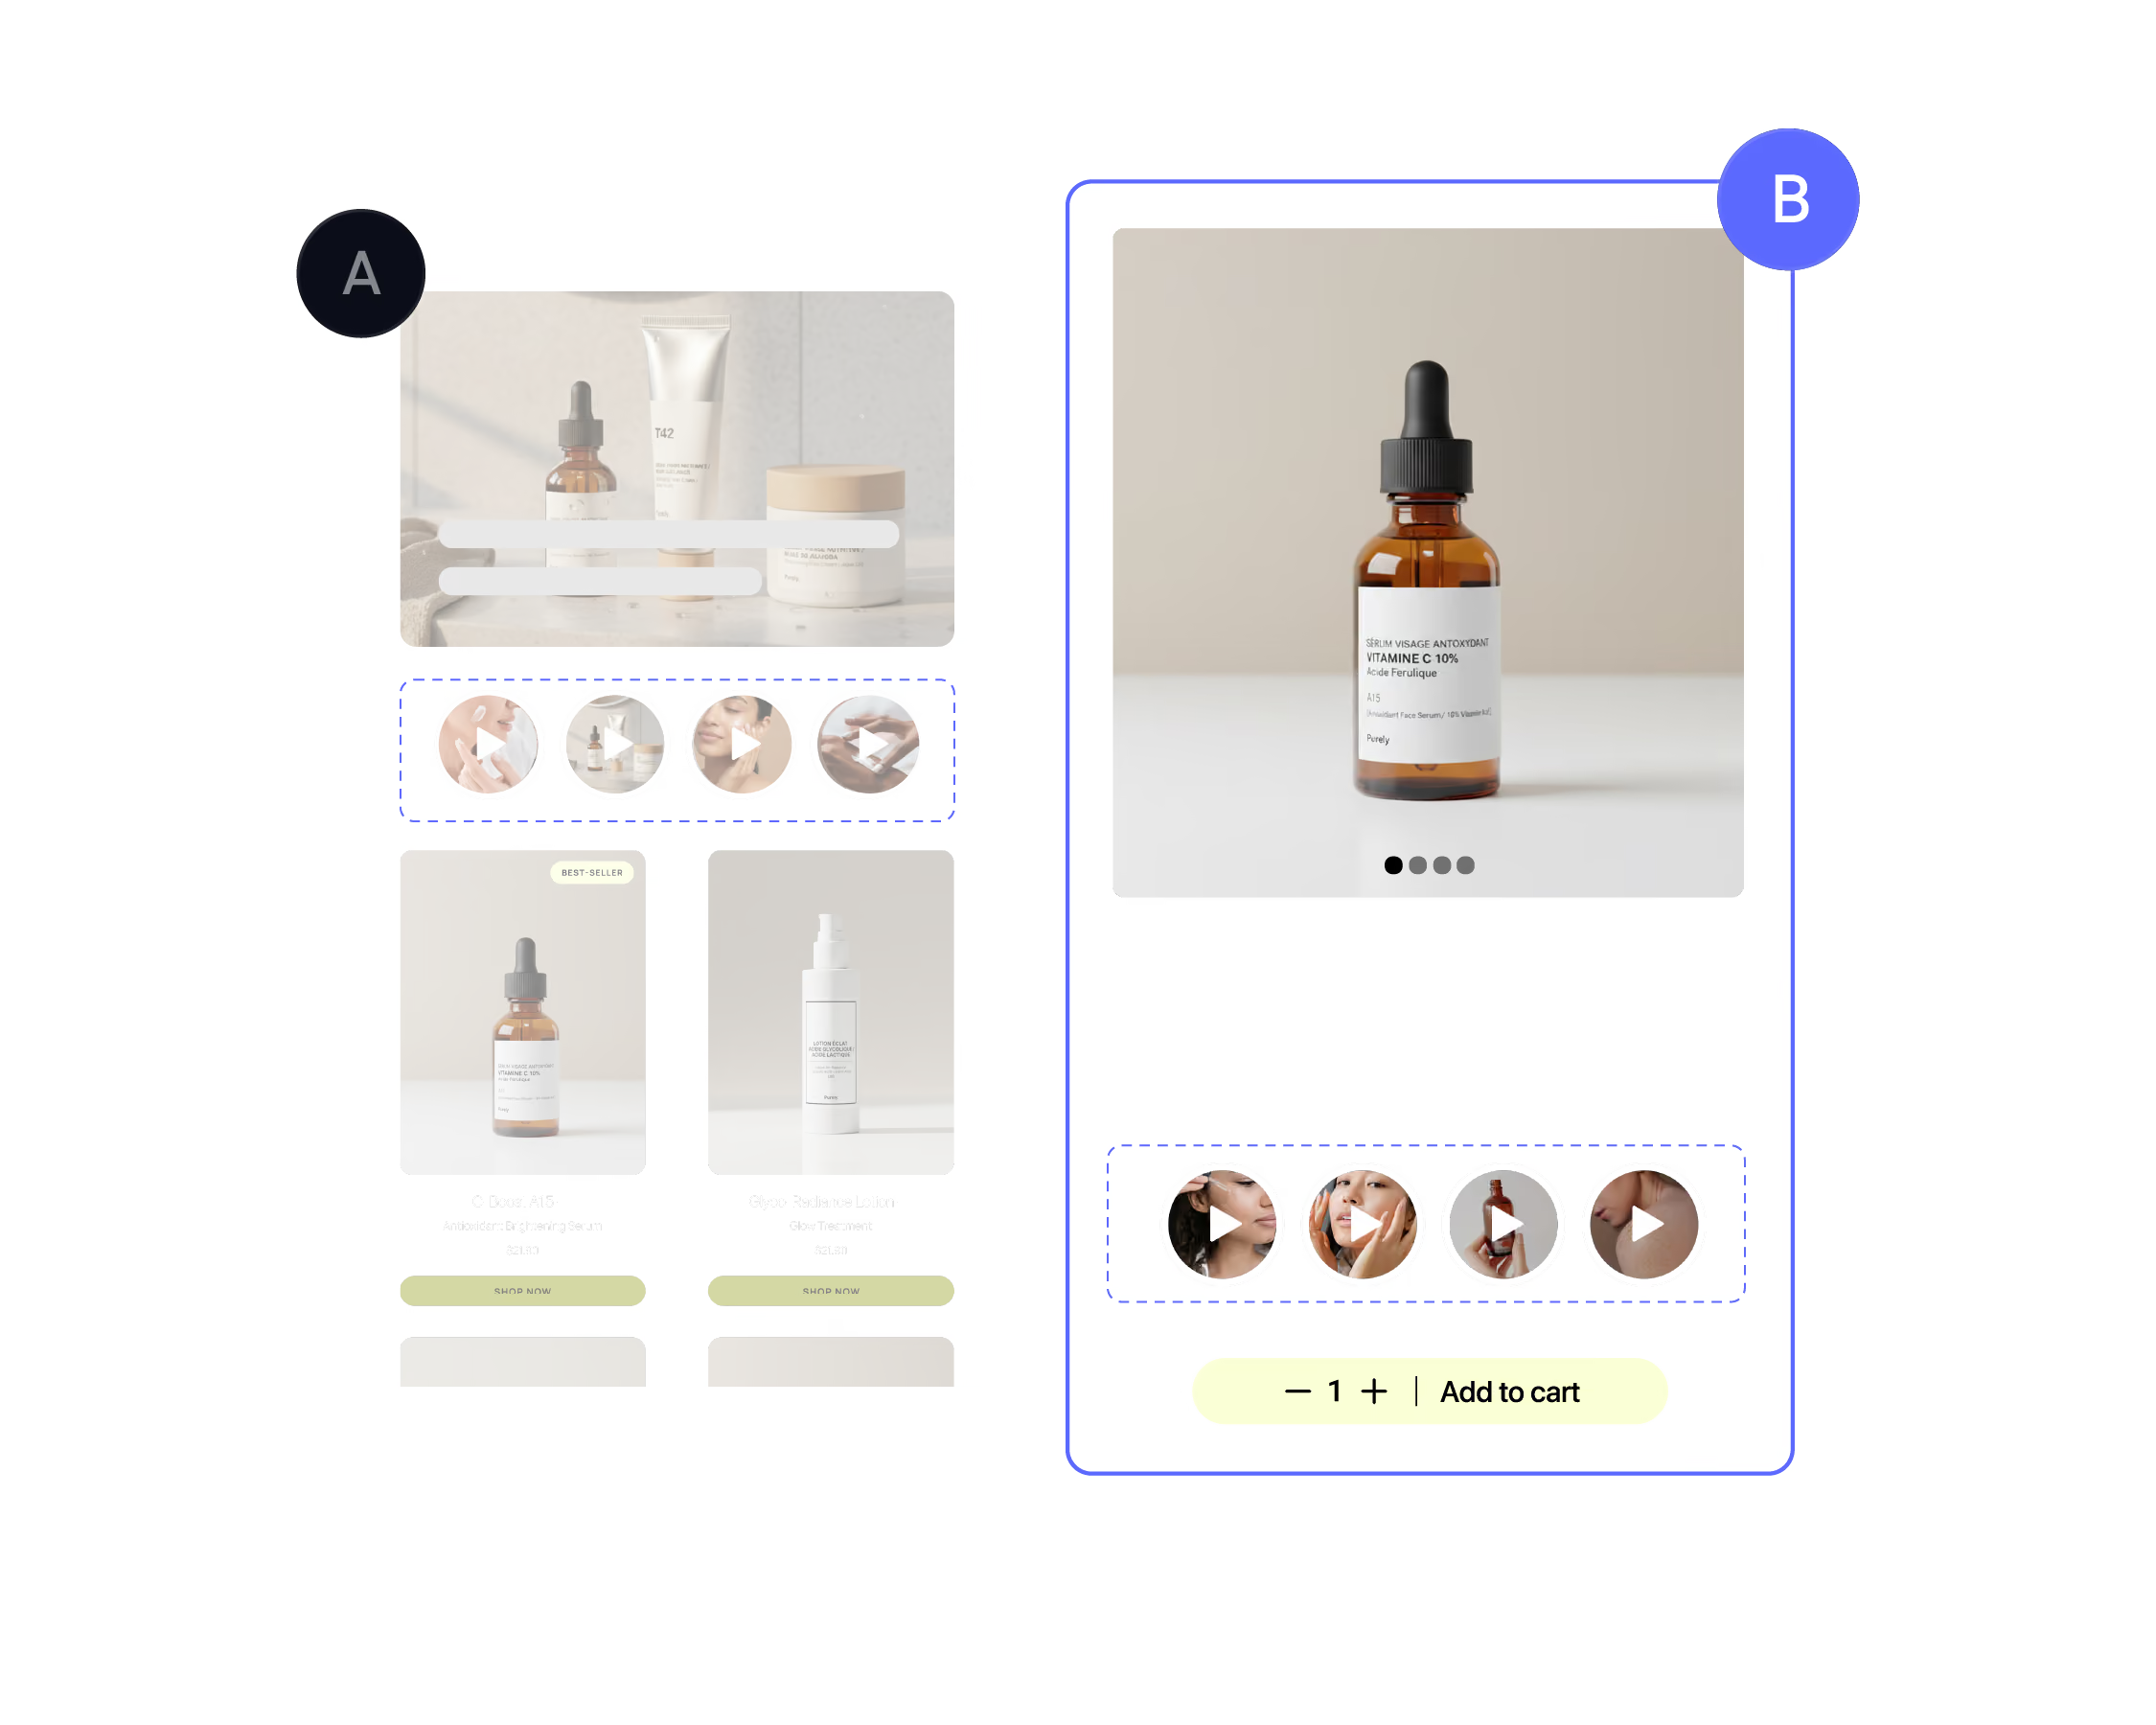
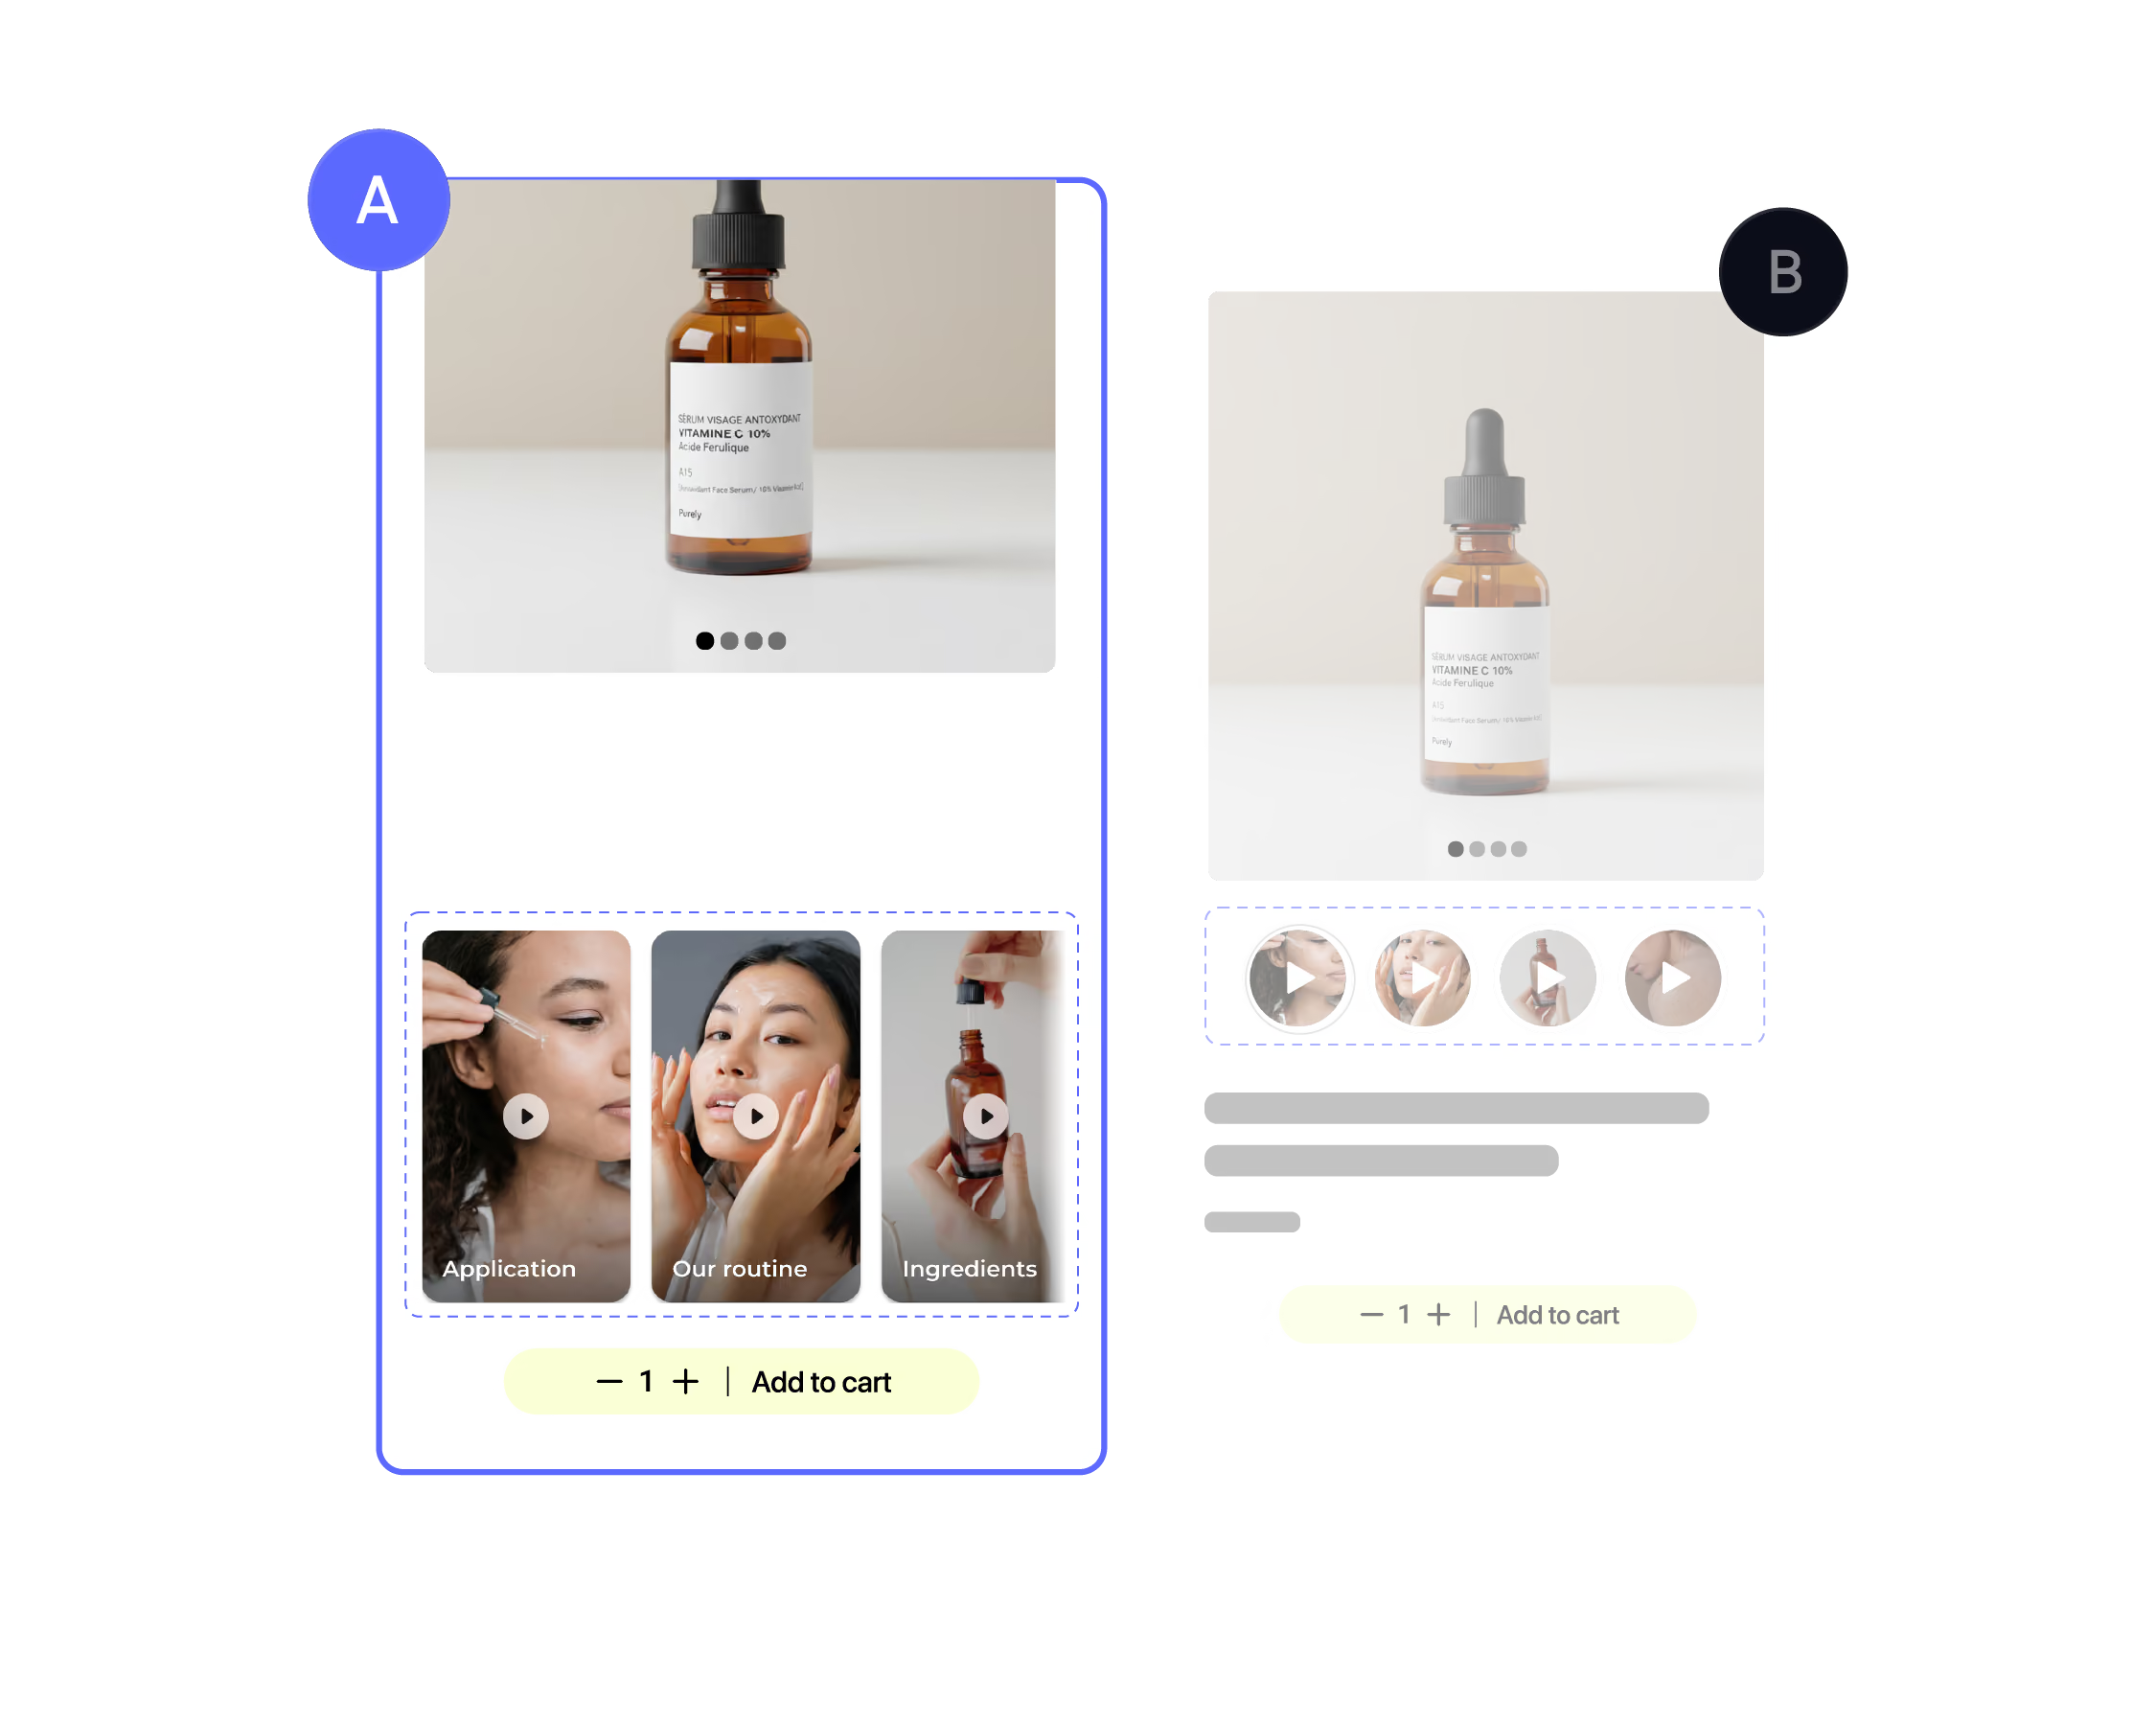
Test widget formats
Evaluate bubbles, cards, squares, and more to find what works best.
Why brands choose JOIN
Native video attribution
Understand the true impact of video on sales.

Faster decision-making
Know exactly what to scale.

CRO expertise included
Get guidance from ecommerce conversion specialists.
Measure the real impact of your videos.
Identify what drives conversion, and continuously improve performance with built-in A/B testing.
FAQs
What is ecommerce video analytics?
Ecommerce video analytics helps brands understand how videos influence customer behavior, including engagement, add-to-cart rate, conversion rate, and revenue generated.
Additional metrics commonly analyzed include time on site, bounce rate, and pages viewed. Unlike traditional video analytics, it focuses on business outcomes rather than views alone.
How does revenue attribution work?
JOIN tracks the customer journey from video interaction to purchase, allowing brands to understand which shoppable videos contribute to sales and revenue
What can I A/B test?
You can test videos, placements, formats, designs, CTAs, and complete page experiences to identify which variations generate the best results.
Can I measure the impact of video on conversion rate?
Yes. JOIN directly connects video engagement to conversion metrics, helping brands measure the impact of their video strategy on ecommerce performance.
To understand the true impact of video, we recommend running A/B tests between experiences with and without video. This allows you to measure the uplift generated by video and accurately quantify the incremental revenue, add-to-cart rate, and conversions it drives.
How long does it take to get statistically significant results?
It depends on your traffic volume and test configuration. In most cases, we recommend running a test for at least two weeks to gather sufficient data and achieve a reliable level of statistical significance.
JOIN automatically analyzes performance and helps you determine when results are statistically reliable enough to make a confident decision.
Can I analyze performance by product or page?
Yes. You can segment analytics by product, page, content type, device, placement, and other dimensions to identify optimization opportunities.